Hello friends,
When I look the dBFS graphs in Export/Report Analysis, I see yellow and blue.
What does mean each of these colors in these graphs?
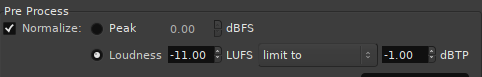
Here’s the screenshot :
Hello friends,
When I look the dBFS graphs in Export/Report Analysis, I see yellow and blue.
What does mean each of these colors in these graphs?
Here’s the screenshot :
Thanks Robin ![]()
Does it means that the blue color can appears only when there’s a limiter on the master bus?
(here it is: x42 DPL plugin is on the master bus)
It’s now clear to me ![]()
Thanks again Robin ![]()
This topic was automatically closed 91 days after the last reply. New replies are no longer allowed.